USDX
SOFR strip
dollar crowd · via fintwit
EUR/USD
SOFR curves: dates
money printer
cents owned per $1 owed
 US 3.7%UK 1.1%JP 0.3%CA, FR, IT: zero · DE: not reported (its gold sits with the Bundesbank)
notes
Canada original count includes 36.4% of GDP in public pension fund assets (CPP/QPP, 2025; CPP Investments alone 22.0%). the pensions promised against them aren't counted as debt, so the fund is left out here.
Japan original count includes 61.1% of GDP in social security fund assets (2024; GPIF alone 39.4%). the pensions promised against them aren't counted as debt, so the funds are left out here.
France, Italy, Germany social security fund assets left out too: 19.0%, 7.3%, 4.4% of GDP (2025). UK reports no separate social security fund.
US counts 12.2% of GDP in government-employee pension entitlements as debt (2025), unlike most others (Canada 9.8%). left out here for all 7. its Social Security trust fund ($2.56T, 8.3% of GDP, end-2025) holds only Treasury IOUs, so it is in neither column; counting those IOUs as owed: 26¢.
dollar system
onshore base money
onshore us credit
dollars held abroad
eurodollar liquidity pool
offshore credit is 2.7× base money and 0.74× us bank credit · updated 2026-10-19 14:54 PT
offshore dollars as % of onshore
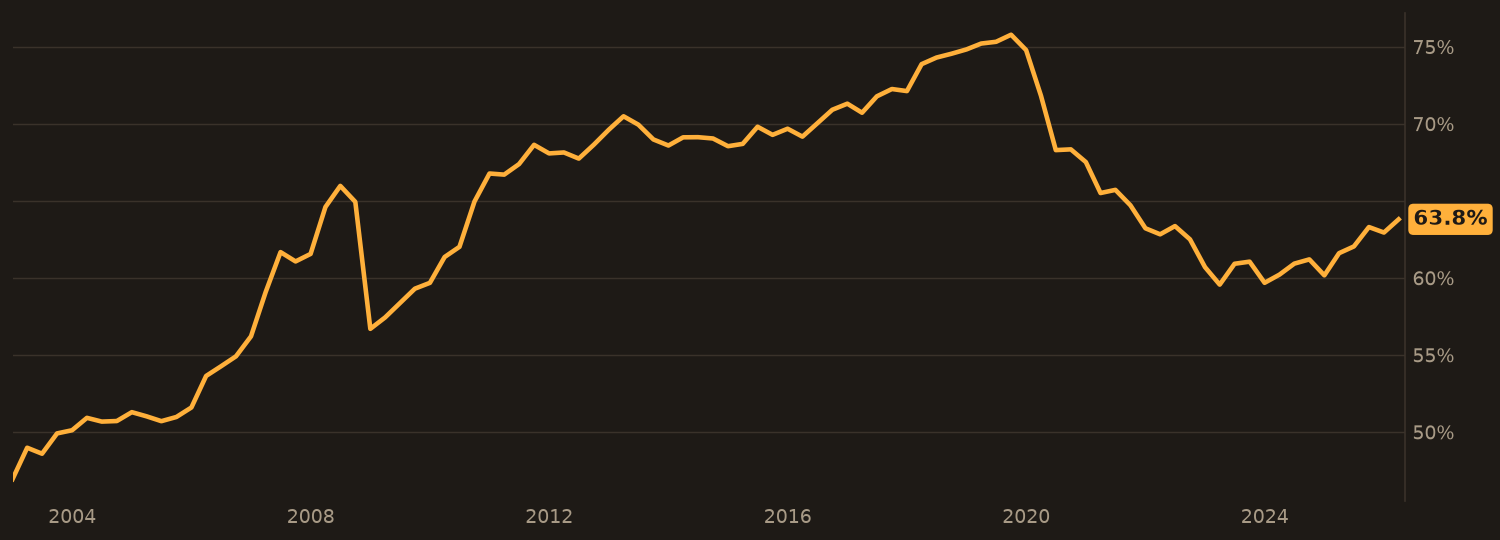
offshore dollars are 63.8% of onshore as of 2026-Q1, up 2.2 pts over 1y and down 1.7 pts over 5y.
(eurodollar pool + dollars held abroad) ÷ (base money + us bank credit), quarter-end. source: bis gli, fed z.1, fred wcurcir, wresbal, totbkcr
leverage gap: offshore vs onshore dollars
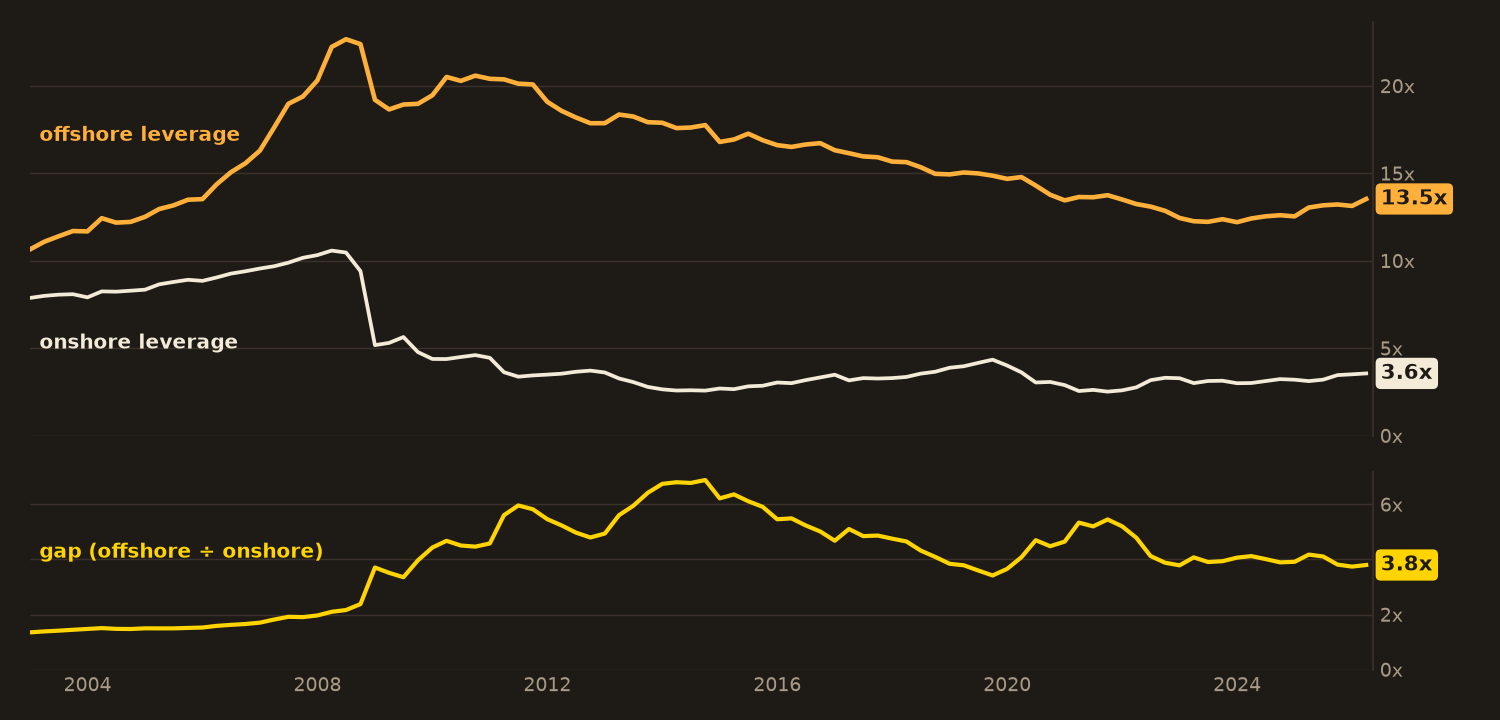
offshore dollars are levered 3.8x as hard as onshore as of 2026-Q1 (13.5x vs 3.6x), down 0.4x over 1y (from 4.2x) and down 1.5x over 5y (from 5.3x).
offshore = eurodollar pool ÷ dollars held abroad · onshore = us bank credit ÷ base money · gap = offshore ÷ onshore, quarter-end. source: bis gli, fed z.1, fred wcurcir, wresbal, totbkcr
stablecoins as % of eurodollar pool vs onshore dollars
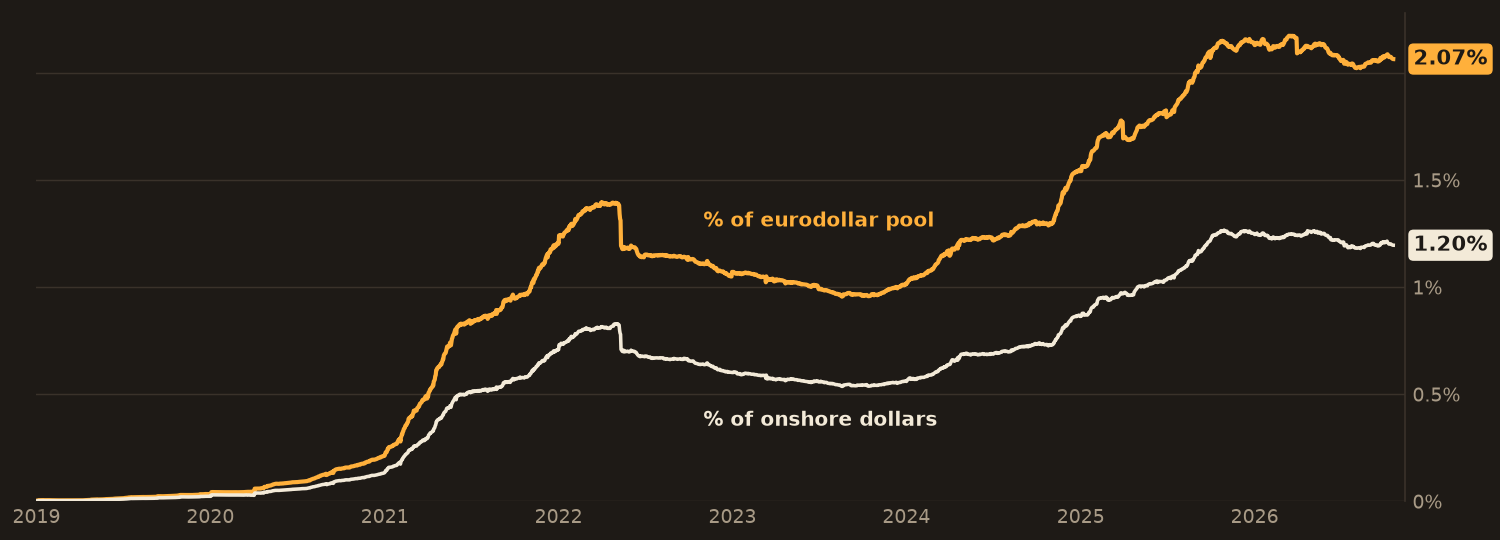
stablecoins are 2.07% of the eurodollar pool, down 0.08 pts over 1y (from 2.14%) and 1.20% of onshore dollars, down 0.06 pts over 1y (from 1.26%), as of 2026-10-19.
usd stablecoin supply (daily) ÷ latest bis eurodollar pool (2026-03-31, stepped each quarter) and ÷ onshore dollars = base money + us bank credit (latest weekly, 2026-10-07). source: defillama, bis gli, fred wcurcir, wresbal, totbkcr